Lauren F. Klein: Speculative Designs: Lessons from the Archive of Data Visualization

Peabody Visualization

Lauren Klein‘s paper looked at two 19th century pioneers of data visualization to see what we could learn from them. She asked,

What is the story we tell about the origins of modern data visualization?

What alternative histories emerge? What new forms might we imagine, and what new arguments might we make, if we told that story differently?

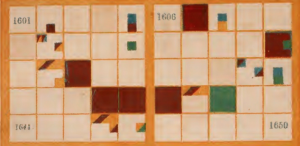
Lauren looked at Elizabeth Peabody for an alternative history who is often overlooked because her visualizations are seen as opaque. She compared it to Playfair who is generally considered the first in the canonical history of visualization. Lauren asked why visualizations need to be clear? Why not imagine visualizations that are opaque and learn from them? Her project is a digital recreation project of Peabody’s thinking.

Read more

Stan Ruecker: The Digital Is Gravy

Timeline Design
Timeline Design

Stan Ruecker gave the 3DH talk on the 23rd of June with the enigmatic title The Digital Is Gravy. He explained the title in reference to gravy being the what gives flavour to the steak. In his case, he wanted to show us how physical prototyping can give substance (steak) to the digital.

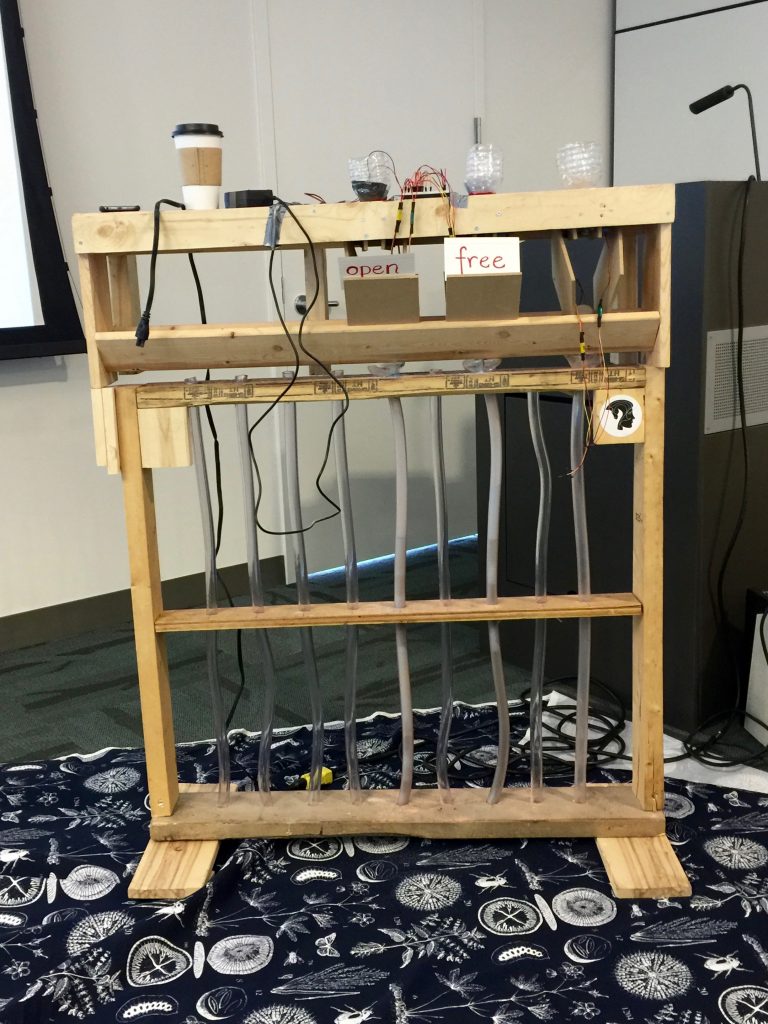
Stan started with an example of a physical prototype that materializes bubblelines that was developed by Milena Radzikowska who showed it at Congress 2016 in Calgary. (See Materializing the Visual.) He suggested that materialization of a visualization slows down analysis and leads to other lines of thought.

At the IIT Institute for Design Stan is weaving physical prototyping into digital design projects. His main research goal is to find ways to encourage people to have multiple opinions. He want to build information systems that encourage the discovery of different perspectives and the presentation of multiple opinions on a phenomenon. The idea is to encourage reflective interpretation rather than dogmatism.

Read more

Leif Isaksen: Revisiting the Tangled Web: On utility and Deception in the Geo-Humanities

Leif Isaksen gave the lecture on the 16th of June. He has a background in history, computer science, philosophy and archaeology. He spends a lot of time thinking about how to represent complex spatial arguments to other people and that has led him to ask how can we read (closely) the historical depictions of geographic space? How can we approach someone else’s visualization when we have only the visualization. He then joked that a better title for his talk might be “Thoughts on Predicting the Ends of the World” where “ends” can mean goals in representing the world.

Some of the things we have to think about when reading historical visualizations include:

  • Classification – how is the world classified when the visualization was drawn up?
  • Derived vs manually produced data – how did the data get to the cartographer and, for that matter, how did the map get to us?
  • Graphic vs. textual representations – we are continually transforming representations from visual to textual and back – what happens in the transcoding?
  • Epistemology – how do we know what we think we know?
  • Time and change – how is time and change collapsed in representations of space?
  • Completeness – we never have complete information, but sometimes we think we do
  • Data proxies – we are not interacting with the phenomenon itself, but with surrogates
  • Geography – what is special about the world?

He then showed 4 case studies.

Read more

Laura Mandell: Visualizing Gender Complexity

Laura started her talk by showing some simple visualizations and talking about the difficulties of reading graphs. She showed Artemis, searching for words “circumstantial” and “information” over time. She then compared it to the Google NGram viewer. She talked about the problems with the NGram viewer like shifts in characters (from f to s) around 1750. Dirty OCR makes a difference too. She showed a problem with Artemis having to do with the dropping out of a dataset. Artemis has a set of datasets, but not all for all time so when one drops out you get a drop in results.

Even when you deal with relative frequency you can get what look like wild variations. These often are not indicative of something in the time, but indicate a small sample size. The diachronic datasets often have far fewer books per year in the early centuries than later so the results of searches can vary. One book with the search pattern can appear like a dramatic bump in early years.

There are also problems with claims made about data. There is a “real world” from which we then capture (capta) information. That information is not given but captured. It is then manipulated to produce more and more surrogates. The surrogates are then used to produce visualizations where you pick what you want users to see and how. All of these are acts of interpretation.

What we have are problems with tools and problems of data. We can see this in how women are represented datamining, which is what this talk is about. She organized her talk around the steps that get us from the world to a visualization. Her central example was Matt Jocker’s work in Macroanalysis on gender that seemed to suggest we can use text mining to differentiate between women and men writing.

Read more

Johanna Drucker: Visualizing Interpretation: A Report on 3DH

Johanna Drucker gave a special lecture on June 6th that reported on the state of the project and where we are going. She started by giving some history to the 3DH project. We went from “create the next generation of visualizations in the digital humanities?” to a more nuanced goal:

Can we augment current visualizations to better serve humanists and, at the same time, make humanistic methods into systematic visualizations that are useful across disciplines outside the humanities?

She commented that there is no lack of visualizations, but most of them have their origins in the sciences. Further, evidence and argument get collapsed in visualization, something we want to tease apart. In doing this, can we create a set of visualization conventions that make humanities methods useful to other disciplines? Some of the things important to the humanities that we want to make evidence include: partial evidence, situated knowledge, and complex and non-singular interpretations.

Project development is part of what we have been focusing on. We have had to ask ourselves “what is the problem?” We had to break the problem down, agree on practices, frame the project, and sketch ideas.

Johanna talked about how we ran a charette on what was outside the frame. She showed some of the designs. Now we have a bunch of design challenges for inside the frame. One principle we are working with is that a visualization can’t be only data driven. There has to be a dialogue between the graphical display and the data. Thus we can have visualization driven data and vice versa.

We broke the tasks down to:

  • Survey visualization types
  • Study pictorial conventions
  • Create graphical activators
  • Propose some epistemological / hermeneutical dimensions
  • Use three dimensionality
  • Apply to cases
  • Consider generalizability

Read more
Materializing the Visual

Materialization of Bubblelines

The Canadian Society for Digital Humanities 2016 conference was held this year in Calgary, Alberta. Milena Radzikowska presented a paper on “Materializing Text Analytical Experiences: Taking Bubblelines Literally” in which she showed a physical system designed to materialize a Bubblelines visualization. (Bubblelines is a tool in the Voyant suite of tools.) In here talk she demonstrated the materialization filling tubes with different coloured sand for the words “open” and “free” as they appeared in a text. She talked about how the materialization changed her sense of time and visualization. Read more about the conference in Geoffrey Rockwell’s conference report.

Mark Grimshaw: Rethinking Sound

Mark Grimshaw from Aalborg University, Denmark gave the lecture yesterday (May 26th) on  Rethinking Sound. (See video of talk here.)

Grimshaw has been interested in game sound for some time and how sound helps create an immersive experience. He is also interested in how games sonify others in a multi-player game (how you hear others). He is also interested in virtual reality and how sound can be used to give verisimilitude.

Why rethink sound? He started by discussing problems with definitions of sound and trying to redefine sound to understand sonic virtuality. The standard definition is that sound is a sound wave. The problem is that there are really two definitions:

  • sound is an oscillation of pressure or sound wave, or
  • sound is an auditory sensation produced by such waves (both from the ANSI documentation)

He mentioned another definition that I rather liked, that sound is “a mechanical disturbance in the medium.” This is from an acoustics textbook: Howard, D. M., & Angus, J. (1996). Acoustics and psychoacoustics. Oxford: Focal Press.

Not all sounds produce an auditory sensation (like ultrasound) and not all sensations are created by sound waves (eg. tinnitus). For that matter, sound also gets defined as that which happens in the brain. The paradox is:

  • Not all sounds evoke a sound, and
  • Not all sounds are evoked by sound.

Read more

Sustainability of Visualizations

Elaborate visual simulations for cultural heritage studies have a sustainability problem. As Erik Champion told us, they are often broken before the project even ends. For that matter, why do most museum interactive exhibits break before I get a chance to try them? If visualizations are to develop as a form of scholarly communication we need to imagine how to build visualizations that are sustainable.

Sustainability of digital scholarship has been addressed by organizations like Ithaka S+R in their Sustaining Our Digital Future: Institutional Strategies for Digital Content (PDF) and by scholars like Jerome McGann in Sustainability: The Elephant in the Room. The Ithaka report rightly points out all the human and technical infrastructure that supports projects that is overlooked and not considered by projects. Projects usually get funding to be created, but not maintenance funding and there are no strategies to develop units like libraries to sustain projects (as opposed to just preserving the data.) McGann points out how the third leg of scholarship, namely the scholarly publishers, is struggling and we need to imagine what a healthy scholarly publishing industry would look like in the digital age.

How can we imagine infrastructure for visualization that is sustainable, not only over the course of a project, but over the time that you share an insight?

Videos available of the lectures

Did you know that the 3DH lectures are available online? Here are the recent lectures: