Lauren Klein‘s paper looked at two 19th century pioneers of data visualization to see what we could learn from them. She asked,
What is the story we tell about the origins of modern data visualization?
What alternative histories emerge? What new forms might we imagine, and what new arguments might we make, if we told that story differently?
Lauren looked at Elizabeth Peabody for an alternative history who is often overlooked because her visualizations are seen as opaque. She compared it to Playfair who is generally considered the first in the canonical history of visualization. Lauren asked why visualizations need to be clear? Why not imagine visualizations that are opaque and learn from them? Her project is a digital recreation project of Peabody’s thinking.
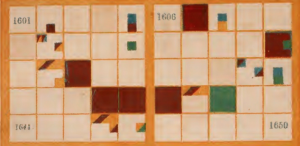
Elizabeth Palmer Peabody (1804-1984) ran a bookstore out of Boston that acted as a salon for the transcendentalists. In 1856 she published a Chronological History of the United States for schools. She traveled around to promote her textbook with a roll of mural charts like domestic rugs (see above). Her charts were based on a Polish process that generated overviews of history.
For modern mavens of visualization like Edward Tufte these charts would not be clear and therefore not effective. By contrast Lauren sees the visualizations of Peabody not as clarifying but as a tool of process or knowedge production. You make knowledge rather than consume it when you make a chart. The clarity to those who didn’t make it is besides the point.
Peabody also sold workbooks for students of school that used the textbook so that they could follow the lessons and rules to generate patterns. Hers is is an argument for making and this making has a historical context. Peabody rejected a single interpretation of history and imagined a visualization system that encourages different interpretations.
This led to one of the points of the talk and that was that the very idea of visualization is itself historically situated and should be examined. And this led to looking again at the canonical works of William Playfair.
She then showed us some of Playfair’s visualizations (from The Commercial and Political Atlas) that are much more readable and for that reason he is often seen as a pioneer in data visualization. Playfair is widely considered one of the first to abstract phenomena to data for visualization. Lauren pointed out how Playfair was not sure how his visualizations would be interpreted, but he did want them to make an impression that was “simple and complete.” He was good at this.
She then showed Lyra: A Visualization Design Environment, an open source alternative to Tableau. There are a lot of Playfair emulators who use things from Lyra to everyday tools like Excel to recreate Playfair’s charts. There are plenty of tools now out there with which one can create visualizations including try to emulate Playfair.
What is interesting is that the designers of the professional tools made decisions about what visualizations should or could do. Thus we see a lot of line and bar charts and little resembling Peabody’s. The widely held belief is that visualization should condense and clarify.
Recreating Peabody
Lauren then shifted to describing an ongoing project to recreate some of Playfair and Peabody’s charts with different tools. They found the existing tools, like D3, hard to use. The tools all assume you start with data. This made her think of the status of data and its relationship to visualization.
She pointed out that when you use a tool for visualization you don’t worry about the shape of the curve, you let the tool do that. Playfair did, however worry about it. He had to engrave the curves by hand and he played with the lines trying to make them attractive to the eye.
Watt, for whom Playfair worked, suggested to him that he put the tables next to the charts. He did this in the first two editions of his book (and then removed the tables for the third.) Even with those charts some of the graphs are hard to recreate. To make one of Playfair charts they had to use data from two different places in Playfair. Again, almost all tools, like D3, now depend on data. The dependence on data is structurally woven in, unlike more artistic tools like Illustrator.
She then showed an engraving error detail and discussed how it could have come about due to Playfair being tired when making the copper plate. In the digital artefact we don’t see such errors – we only see the finished project. The digital masks the labour. Only in Github are changes/labour saved and viewable.
Then she showed the prototypes her team has made including a “build” mode where you can construct a Peabody chart. They are now planning a large scale project using LEDs on fabric to create a physical prototype as that would be closer to the fabric charts Peabody made.
This returned her to labour, especially the labour of women. Peabody made copies of the charts for classes that adopted her book. Alas, none of these survived, but we do have evidence of the drudgery in her letters.
To Lauren the Peabody charts remind her of quilts and she showed examples of quilts from Louisiana that were a form of community knowledge constructing genealogies. Such quilts have only recently been recognized as knowledge comparable to the logocentric knowledge we normally respect.
Lauren closed with a speculative experiment. How would we think differently if Peabody’s charts had been adopted as the standard to be emulated rather than the line charts of Playfair? How might we know differently?
Her team’s recreations of both the Playfair and Peabody charts are just such a sort of speculation – understanding though making.
You can watch the video with slides here.