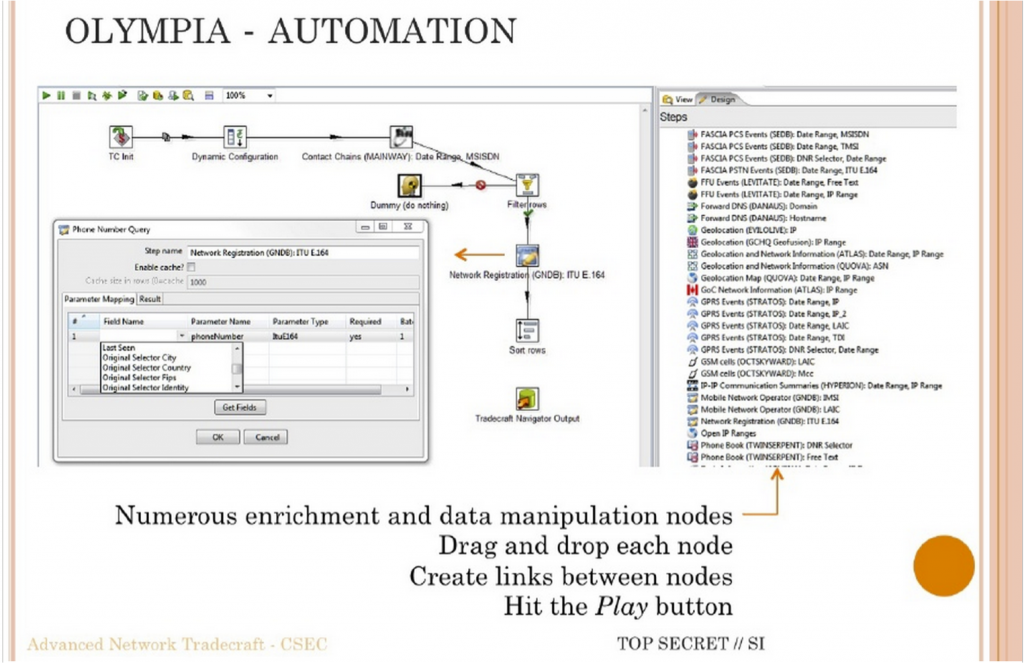
I (Geoffrey Rockwell) gave the May 12th lecture on the subject of visual programming languages (VPL). I started by providing a surveillance context for understanding why VPLs are developed to provide a way into programming. The context was the CSEC slide deck leaked by Snowden that shows the Olympia Network Knowledge Engine which allows analysts to access other tools from the 5-Eyes services. Olympia includes a VPL for creating “chains” that automate surveillance processes (see the slide above in which the VPL is introduced.) I argued that in many ways we in the humanities also do surveillance (of cultural history) and we pay attention to tools like Olympia developed to help analysts automate interpretative tasks. I also argued that we need to study these types of slide decks as examples of how big data analysis is conceived. These are the types of tools being developed to spy on us and manage us. They are used by governments and corporations. We need to learn to read the software and documentation of algorithmic management.
The heart of the talk was a survey of VPLs. I argued that we have had specialized formal visual languages for some time for describing wiring diagrams or signalling plans for train stations. These languages allow someone to formally represent a process or design. I then gave a brief history of visual programming and then turned to VPLs in the digital humanities. This connected to a survey of some types of VPLs as I wanted to go beyond the pipe-and-flow types of VPL. I then summarized some of the opportunities and challenges for VPLs in the digital humanities and returned to Olympia. VPLs only work when there is a community that develops and understands the semantics of their visual language. Wiring diagrams work because people understand what a line connecting two icons means and what the icons mean in the context of electronics. For visualization in general and VPLs in particular to work in the humanities we need to develop both a visual literacy and a discussion around the meaning of visual semantics. One way to do that is to learn to read VPLs like Olympia. Again, the humanities need to take seriously these new types of documents as important and worth studying – both PowerPoint decks (that are handed around as a form of communication) and software like VPLs.
Visual Programming in the Digital Humanities
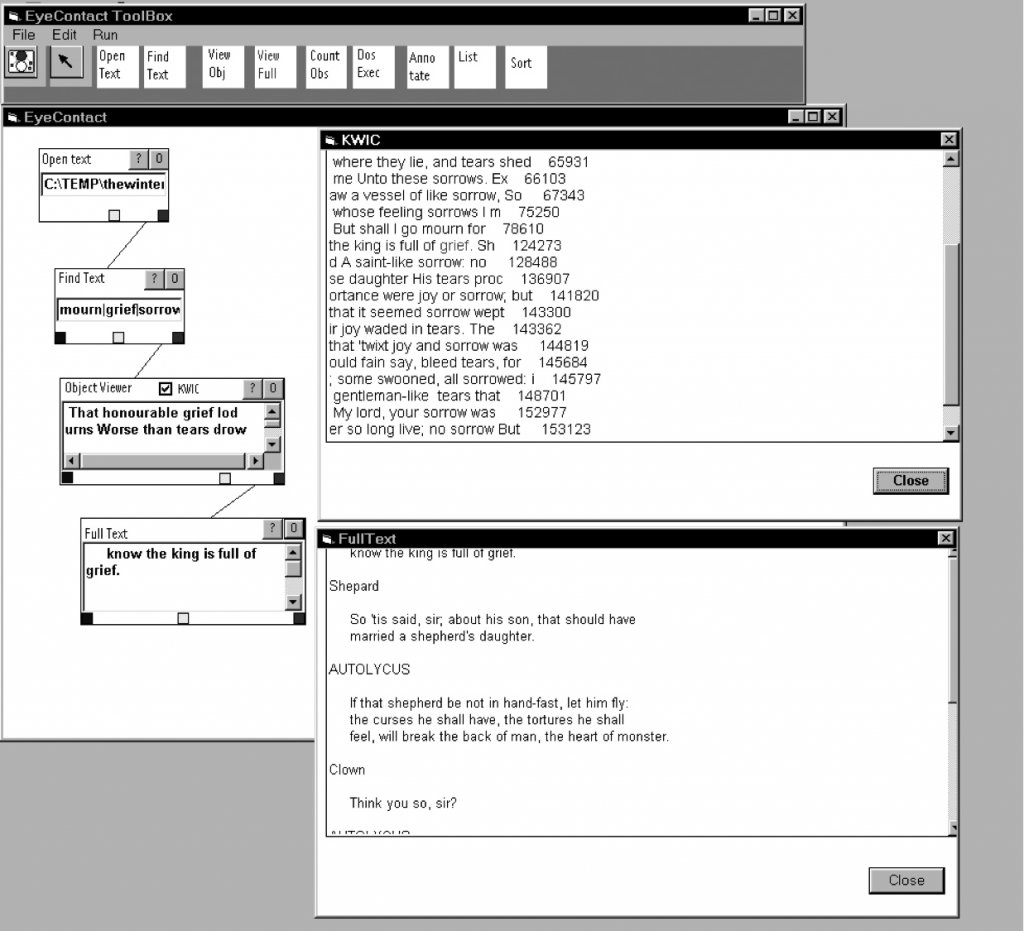
One of the first projects in the digital humanities to prototype a VPL for text analysis was the EyeConTact project by Geoffrey Rockwell and John Bradley. See also a paper Seeing the Text Through the Trees: Visualization and Interactivity in Textual Applications from LLC in 1999. This was inspired by scientific visualization tools like Explorer. Before that there were many projects that shared flowcharts of their programs. For example we have flowcharts of both how computers fit in scholarly concording and how the concording tools worked for PRORA. One can see how generations of programmers raised on flowcharting their programs would desire a flowcharting tool that actually was the programming.
The SEASR project developed a much more sophisticated VPL called Meandre. See Ian Milligan’s discussion of using Meandre. Meandre was designed to allow humanists a way of using all the power of SEASR. Alas, it doesn’t seem to be still maintained.
The best system currently available is built on an open VPL called Orange. Aris Xanthos has developed text analysis modules for Orange called Textable. Xanthos has a paper on TEXTABLE: programmation visuelle pour l’analyse de données textuelles (French). Orange is a well supported VPL that can be extended.
Opportunities and Challenges
Some of the points about the suitability of VPLs to the digital humanities that I made at the end include:
- VPLs are intuitively attractive
- Visual vocabulary is not always clear. What does a pipe mean? What direction do pipes go? Left to right? What flows through a pipe?
- Domain specific applications work best.
- We need to develop a community of use
- VPLs are good at the visualization of process (and data and results in that context). They show rather than hide the processes in a way that can be explored and fiddled with. They are good for showing the chain of filters and transformations that data goes through.
- VPLs are slower than traditional coding for proficient programmers.
- They can be fiddly.
- It is hard to handle a big codebase with a VPL as you end up hiding chains.
- The are good a showing chains of processes, but not at showing highly interactive systems.
Conclusions
Above all, as mentioned above, we need to learn to read visualizations (including VPLs) in the humanities. These are forms of communication that are increasingly important in the algorithmic state. They are used widely in business and government. They are essential to understanding how big data is consumed and used. I propose that developing a discourse and hermeneutics of visualization is fundamental to developing better visualization tools. The two go hand in hand.