Visualisation of literary narratives: How to support text analysis with visualisations? – Creating a narratological use case

 First Co-Creation Workshop in Potsdam, April 26th, 2017

The 3DH project aims to lay the foundations for a ‘next-generation’ approach to visualisation in and for the Humanities. As for the theoretical background, the project’s frame of reference are the particular epistemological principles that are relevant to hermeneutic disciplines and which must therefore also orientate our approach to visualisation.

For the 3DH visualisation concept we formulate four postulates. These are

  1. the “2 way screen postulate” (i.e. an interaction focused approach toward visualisation);
  2. the “parallax postulate“ (i.e. the idea that visualisation in and for the humanities should not just tolerate, but actively put to use the power of visual multiperspectivity in order to realise epistemic multiperspectivity);
  3. the “qualitative postulate” (i.e. the idea that visualisations should not just ‘represent’ data, but also offer a means to make and exchange qualitative statements about data);
  4. the “discursive postulate” (i.e. the idea that visualisations should not just be used to illustrate an already formed argument or line of reasoning, but should also become functional during the preceding/subsequent steps of reasoning, such as exploration of phenomena and data, generation of hypotheses, critique and validation, etc.).

During the 2016 summer term we organized a public lecture series on DH visualisations (see also 3DH blog and  https://lecture2go.uni-hamburg.de/l2go/-/get/v/19218).

One outcome of the lecture series was a need for bringing in the expertise of visual design specialists. By bringing together the “two worlds” of literary studies and visual design we hope to transcend the limitations of our respective visual(ising) routines.

Co-teaching seminar University of Applied Science of Potsdam and University of Hamburg

In the 2016 summer term we have begun to engage in a co-teaching project with the visual design specialists Marian Dörk and Jan Erik Stange from the University of Applied Science Potsdam. Two groups of students meet during four workshops alternately held in Potsdam and in Hamburg, one a class of German literature master students (Prof. Chris Meister, Universität Hamburg), the second a class of design students (Prof. Marian Dörk).  Their joint goal is  to answer two questions:

  • ‘In how far can visualisations be helpful for the analysis of literary texts?’ and
  • ‘Where do visualisations have their place in a subjective and interpretive structure?’

The literary text under discussion is the novel Johannisnacht by the German author Uwe Timm, published in 1996. It tells the story of a writer suffering from writer’s block, who gets the opportunity to write a report about the history of the potato.


Read more

VIS2016 – K. Coles: Show ambiguity

This is the first post in a series of posts about what I think to be most relevant for 3DH from the IEEE VIS2016 conference in Baltimore.

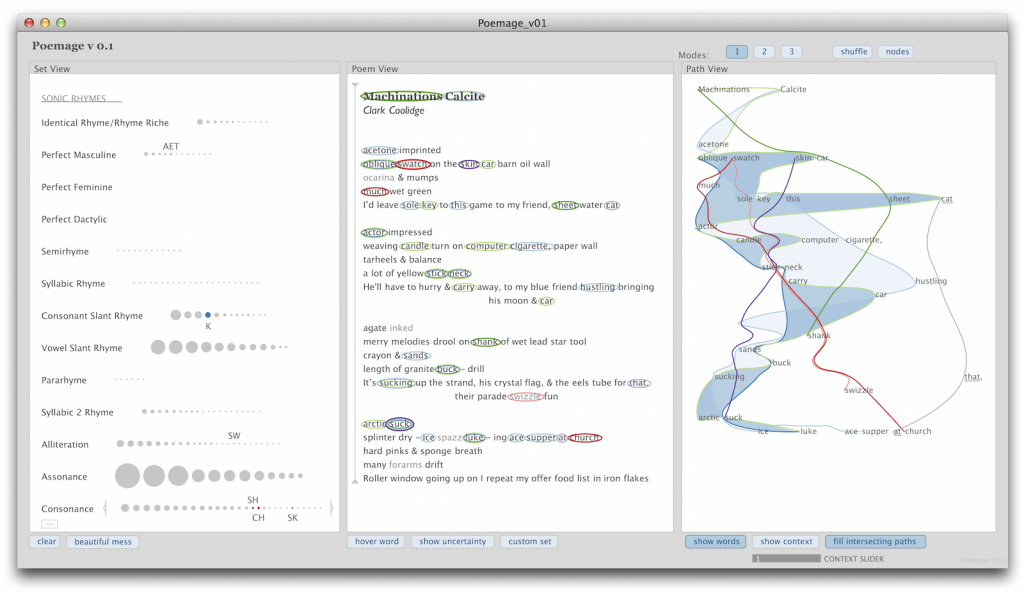
The poetry scholar Katherine Coles gave a presentation on Poemage at the VIS4DH workshop at VIS2016. Poemage is a tool for exploring and analysing the sound topology of a poem. It is an interdisciplinary work between poetry scholars, computer scientists and linguists. Recommended reading is not only the presented paper Show ambiguity, which takes a more poetry scholar influenced perspective on Poemage but also the companion paper which complements “Show ambiguity” by adding the computer scientist stance to it. Besides the methodological principles that are covered by Poemage both papers give also great insight into the collaborative aspects of the project across disciplines.

poemage

The UI of Poemage offers three views. The Set View offers rhyme sets, which are sets of words that are connected by a specific rhyme scheme. The rhyme sets are organized by rhyme types. Each circle represents a specific rhyme set. The size of the circle depends on the number of words in the set. The Poem View shows the poem in its original form and the Path View gives a 2D space where the flow of the poem according to its rhyme topology is displayed. Each node in the path view represents a word in the poem and is positioned in relation to its position in the layout of the poem. The curves show the flow of a rhyme set through the poem. The views are linked by color coding and by interaction: e. g. selecting a rhyme set in the Set View also activates the visualization of that rhyme set in the other two views.

I like especially the openness of the tool. It supports and encourages multiple readings and the rhyme types are extensible in two ways. The simple way allows the scholar to group words freely to form custom sets without being bound to any predefined rhyme type. The more complex way allows the scholar to access the underlying rules engine or formalism to formulate new rhyme types in a notation which is geared to poetry scholars.

The representation of rhyme sets as paths allows exploration of the rhyme topology by examining spatial phenomena of the paths like intersections, mergings and divisions. There is a tight link between the visualisation and the poem that makes it easy to trace back observations in the visualization to the original data.

Another interesting aspect of her talk was when Coles shared her view on the humanistic idiosyncrasies of data visualization, especially in poetry scholarship. She wanted Poemage “to provide an aesthetically enriched experience” and emphasized the engagement between scholar and object of study which should extend to the visualization as well.

When we discussed the special needs for the humanities for visualization in the 3DH project so far, I (with a computer science background) was very sceptical about seeing the humanities on one side and the hard sciences on the other side. On the contrary I can see a lot of common ground between a physicist and a humanities scholar exploring and interpreting his or her data with visualizations. Instead of seeing the two as opposites we in 3DH started to work with a methodological continuum between the poles of subjectivity/uniqueness/particularity and objectivity/reproducibility/universality. I doubt that the kind of engagement Coles describes is the same engagement between a physicist and his or her data. I think Coles managed to describe at least part of the possible contribution of visualisation to one extreme of that continuum. And this really helps to track down the methodological differences 3DH visualizations need to account for.

Leif Isaksen: Revisiting the Tangled Web: On utility and Deception in the Geo-Humanities

Leif Isaksen gave the lecture on the 16th of June. He has a background in history, computer science, philosophy and archaeology. He spends a lot of time thinking about how to represent complex spatial arguments to other people and that has led him to ask how can we read (closely) the historical depictions of geographic space? How can we approach someone else’s visualization when we have only the visualization. He then joked that a better title for his talk might be “Thoughts on Predicting the Ends of the World” where “ends” can mean goals in representing the world.

Some of the things we have to think about when reading historical visualizations include:

  • Classification – how is the world classified when the visualization was drawn up?
  • Derived vs manually produced data – how did the data get to the cartographer and, for that matter, how did the map get to us?
  • Graphic vs. textual representations – we are continually transforming representations from visual to textual and back – what happens in the transcoding?
  • Epistemology – how do we know what we think we know?
  • Time and change – how is time and change collapsed in representations of space?
  • Completeness – we never have complete information, but sometimes we think we do
  • Data proxies – we are not interacting with the phenomenon itself, but with surrogates
  • Geography – what is special about the world?

He then showed 4 case studies.

Read more