Lauren F. Klein: Speculative Designs: Lessons from the Archive of Data Visualization

Peabody Visualization

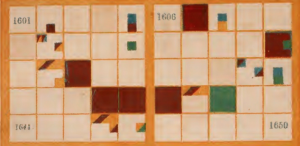
Lauren Klein‘s paper looked at two 19th century pioneers of data visualization to see what we could learn from them. She asked,

What is the story we tell about the origins of modern data visualization?

What alternative histories emerge? What new forms might we imagine, and what new arguments might we make, if we told that story differently?

Lauren looked at Elizabeth Peabody for an alternative history who is often overlooked because her visualizations are seen as opaque. She compared it to Playfair who is generally considered the first in the canonical history of visualization. Lauren asked why visualizations need to be clear? Why not imagine visualizations that are opaque and learn from them? Her project is a digital recreation project of Peabody’s thinking.

Read more

Stan Ruecker: The Digital Is Gravy

Timeline Design
Timeline Design

Stan Ruecker gave the 3DH talk on the 23rd of June with the enigmatic title The Digital Is Gravy. He explained the title in reference to gravy being the what gives flavour to the steak. In his case, he wanted to show us how physical prototyping can give substance (steak) to the digital.

Stan started with an example of a physical prototype that materializes bubblelines that was developed by Milena Radzikowska who showed it at Congress 2016 in Calgary. (See Materializing the Visual.) He suggested that materialization of a visualization slows down analysis and leads to other lines of thought.

At the IIT Institute for Design Stan is weaving physical prototyping into digital design projects. His main research goal is to find ways to encourage people to have multiple opinions. He want to build information systems that encourage the discovery of different perspectives and the presentation of multiple opinions on a phenomenon. The idea is to encourage reflective interpretation rather than dogmatism.

Read more

Laura Mandell: Visualizing Gender Complexity

Laura started her talk by showing some simple visualizations and talking about the difficulties of reading graphs. She showed Artemis, searching for words “circumstantial” and “information” over time. She then compared it to the Google NGram viewer. She talked about the problems with the NGram viewer like shifts in characters (from f to s) around 1750. Dirty OCR makes a difference too. She showed a problem with Artemis having to do with the dropping out of a dataset. Artemis has a set of datasets, but not all for all time so when one drops out you get a drop in results.

Even when you deal with relative frequency you can get what look like wild variations. These often are not indicative of something in the time, but indicate a small sample size. The diachronic datasets often have far fewer books per year in the early centuries than later so the results of searches can vary. One book with the search pattern can appear like a dramatic bump in early years.

There are also problems with claims made about data. There is a “real world” from which we then capture (capta) information. That information is not given but captured. It is then manipulated to produce more and more surrogates. The surrogates are then used to produce visualizations where you pick what you want users to see and how. All of these are acts of interpretation.

What we have are problems with tools and problems of data. We can see this in how women are represented datamining, which is what this talk is about. She organized her talk around the steps that get us from the world to a visualization. Her central example was Matt Jocker’s work in Macroanalysis on gender that seemed to suggest we can use text mining to differentiate between women and men writing.

Read more

Johanna Drucker: Visualizing Interpretation: A Report on 3DH

Johanna Drucker gave a special lecture on June 6th that reported on the state of the project and where we are going. She started by giving some history to the 3DH project. We went from “create the next generation of visualizations in the digital humanities?” to a more nuanced goal:

Can we augment current visualizations to better serve humanists and, at the same time, make humanistic methods into systematic visualizations that are useful across disciplines outside the humanities?

She commented that there is no lack of visualizations, but most of them have their origins in the sciences. Further, evidence and argument get collapsed in visualization, something we want to tease apart. In doing this, can we create a set of visualization conventions that make humanities methods useful to other disciplines? Some of the things important to the humanities that we want to make evidence include: partial evidence, situated knowledge, and complex and non-singular interpretations.

Project development is part of what we have been focusing on. We have had to ask ourselves “what is the problem?” We had to break the problem down, agree on practices, frame the project, and sketch ideas.

Johanna talked about how we ran a charette on what was outside the frame. She showed some of the designs. Now we have a bunch of design challenges for inside the frame. One principle we are working with is that a visualization can’t be only data driven. There has to be a dialogue between the graphical display and the data. Thus we can have visualization driven data and vice versa.

We broke the tasks down to:

  • Survey visualization types
  • Study pictorial conventions
  • Create graphical activators
  • Propose some epistemological / hermeneutical dimensions
  • Use three dimensionality
  • Apply to cases
  • Consider generalizability

Read more
Mark Grimshaw: Rethinking Sound

Mark Grimshaw from Aalborg University, Denmark gave the lecture yesterday (May 26th) on  Rethinking Sound. (See video of talk here.)

Grimshaw has been interested in game sound for some time and how sound helps create an immersive experience. He is also interested in how games sonify others in a multi-player game (how you hear others). He is also interested in virtual reality and how sound can be used to give verisimilitude.

Why rethink sound? He started by discussing problems with definitions of sound and trying to redefine sound to understand sonic virtuality. The standard definition is that sound is a sound wave. The problem is that there are really two definitions:

  • sound is an oscillation of pressure or sound wave, or
  • sound is an auditory sensation produced by such waves (both from the ANSI documentation)

He mentioned another definition that I rather liked, that sound is “a mechanical disturbance in the medium.” This is from an acoustics textbook: Howard, D. M., & Angus, J. (1996). Acoustics and psychoacoustics. Oxford: Focal Press.

Not all sounds produce an auditory sensation (like ultrasound) and not all sensations are created by sound waves (eg. tinnitus). For that matter, sound also gets defined as that which happens in the brain. The paradox is:

  • Not all sounds evoke a sound, and
  • Not all sounds are evoked by sound.

Read more

Videos available of the lectures

Did you know that the 3DH lectures are available online? Here are the recent lectures:

Watching Olympia: Visual Programming for Surveillance

visualprogramming
Olympia Visual Programming Slide

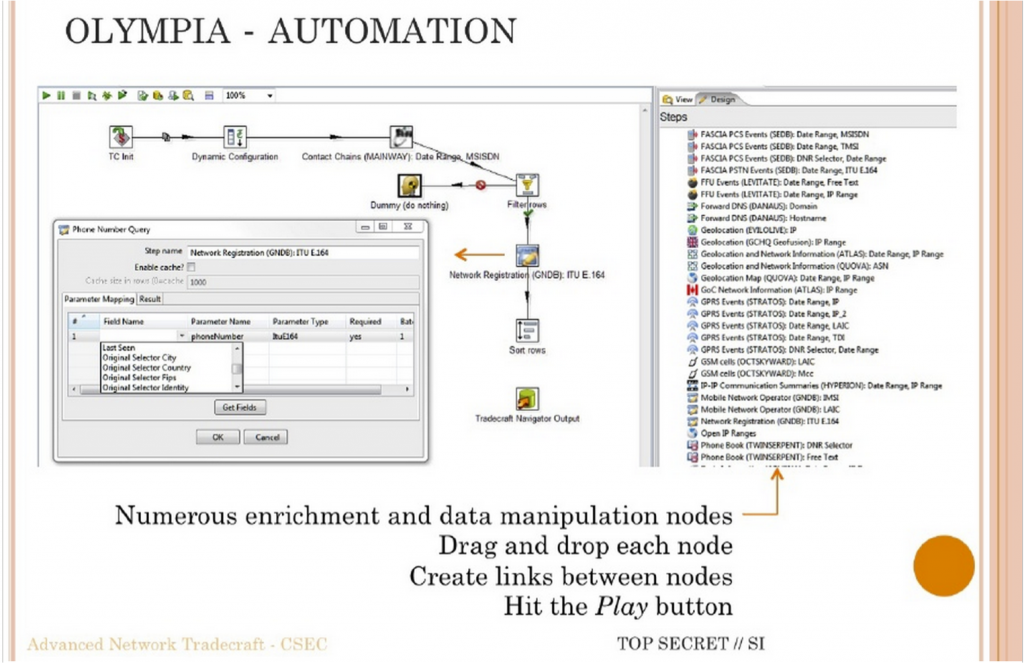
I (Geoffrey Rockwell) gave the May 12th lecture on the subject of visual programming languages (VPL). I started by providing a surveillance context for understanding why VPLs are developed to provide a way into programming. The context was the CSEC slide deck leaked by Snowden that shows the Olympia Network Knowledge Engine which allows analysts to access other tools from the 5-Eyes services. Olympia includes a VPL for creating “chains” that automate surveillance processes (see the slide above in which the VPL is introduced.) I argued that in many ways we in the humanities also do surveillance (of cultural history) and we pay attention to tools like Olympia developed to help analysts automate interpretative tasks. I also argued that we need to study these types of slide decks as examples of how big data analysis is conceived. These are the types of tools being developed to spy on us and manage us. They are used by governments and corporations. We need to learn to read the software and documentation of algorithmic management.

The heart of the talk was a survey of VPLs. I argued that we have had specialized formal visual languages for some time for describing wiring diagrams or signalling plans for train stations. These languages allow someone to formally represent a process or design. I then gave a brief history of visual programming and then turned to VPLs in the digital humanities. This connected to a survey of some types of VPLs as I wanted to go beyond the pipe-and-flow types of VPL. I then summarized some of the opportunities and challenges for VPLs in the digital humanities and returned to Olympia. VPLs only work when there is a community that develops and understands the semantics of their visual language. Wiring diagrams work because people understand what a line connecting two icons means and what the icons mean in the context of electronics. For visualization in general and VPLs in particular to work in the humanities we need to develop both a visual literacy and a discussion around the meaning of visual semantics. One way to do that is to learn to read VPLs like Olympia. Again, the humanities need to take seriously these new types of documents as important and worth studying – both PowerPoint decks (that are handed around as a form of communication) and software like VPLs.

Read more

Visualizing a Thousand Years: On Jewish Cemeteries and the dH Situation

Martin Warnke presented the lecture on April 28th on the subject of: Visualizing a Thousand Years: On Jewish Cemeteries and dH Situation.

Warnke leads the Institute for Culture and Aesthetics of Digital Media and a research group on Media Cultures of Computer Simulation (German), both at the Leuphana University Lüneburg. He studies knowledge orders of the digital and simulation. His talk had three parts.

  1. First he looked at a dH project that is about visualization of a Jewish cemetery,
  2. Then he discussed the general situation of such projects,
  3. And he concluded by talking about dH in general.

Read more

Johanna Drucker: 3DH

Johanna Drucker gave the third lecture in the 3DH series. She talked about 3 dimensional digital humanities and how she conceives of the road ahead of us. She started with the goal of the project:

To develop a conceptual blueprint for next generation digital humanities visualizations.

What would that mean? How can we do it? To do this we need to understand where we are and where we have to go and her talk did that by touching on:

  1. How visualizations have an imprinted form of argument that comes from their origins.
  2. Understand ideas about languages of form – ideas about how one can systematize the visual.
  3. Look at how contemporary DH people use visualizations and what work do they want them to do.
  4. Understand conventions of pictorial imagery and how most visualizations are pictorially impoverished.
  5. Identify the epistemological challenges ahead.

She noted that 3DH is focusing on the visualizations of humanities documents and humanistic inquiry. Humanists are engaged in the production, interpretation, and preservation of human record. We need to think about problems of our practices like interpretation.

Read more

The Strange Attraction of the Graph

Screenshot
CSEC Summary Slide with Comm Network

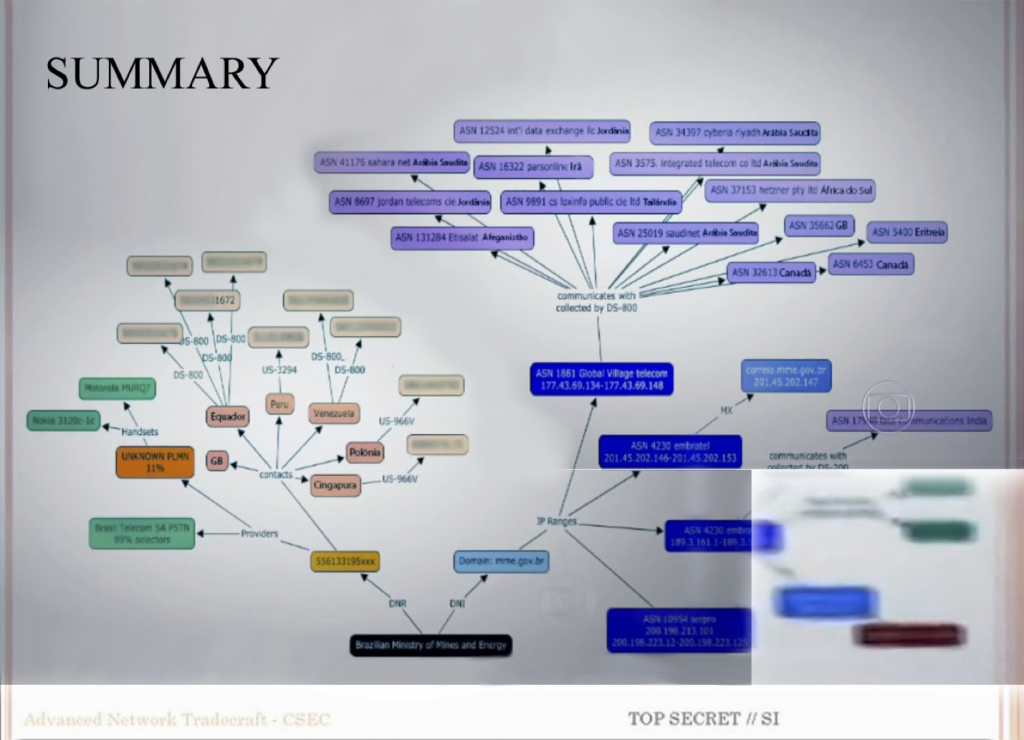
I (Geoffrey Rockwell) gave the second lecture on Thursday the 14th with the title The Strange Attraction of the Graph (video). I started with the image above which is of a PowerPoint slide from one of the decks shared by Edward Snowden. This is the Summary of the CSEC Slides (see my blog entry on these slides) where CSEC showed what their Olympia system could do. The Summary slide shows the results of big data operations in Olympia starting with a target (phone number) and getting a summary of their telecommunications contacts. The image was not in the slides shared by either of the media companies (Fantastico or Globe and Mail) that reported on this as it has too much information. Instead hackers reconstructed it from video that showed it in the background. That gives it the particular redacted and cut-up quality.

I showed this slide as an example of a visualization we want to interpret. My talk addressed the question of how we can interpret visualizations like this, namely graphs in the computing sense of sets of linked points. I didn’t develop a general hermeneutics of visualization, or talk that much about this CSEC slide, but stayed focused on one type of visualization, the graph with nodes (vertices) and edges on a plane.

Read more