Sustainability of Visualizations

Elaborate visual simulations for cultural heritage studies have a sustainability problem. As Erik Champion told us, they are often broken before the project even ends. For that matter, why do most museum interactive exhibits break before I get a chance to try them? If visualizations are to develop as a form of scholarly communication we need to imagine how to build visualizations that are sustainable.

Sustainability of digital scholarship has been addressed by organizations like Ithaka S+R in their Sustaining Our Digital Future: Institutional Strategies for Digital Content (PDF) and by scholars like Jerome McGann in Sustainability: The Elephant in the Room. The Ithaka report rightly points out all the human and technical infrastructure that supports projects that is overlooked and not considered by projects. Projects usually get funding to be created, but not maintenance funding and there are no strategies to develop units like libraries to sustain projects (as opposed to just preserving the data.) McGann points out how the third leg of scholarship, namely the scholarly publishers, is struggling and we need to imagine what a healthy scholarly publishing industry would look like in the digital age.

How can we imagine infrastructure for visualization that is sustainable, not only over the course of a project, but over the time that you share an insight?

Framing Visualization

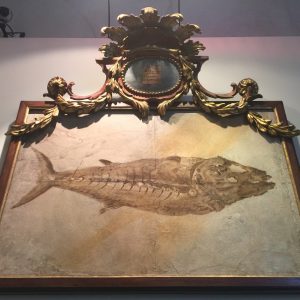
Historic specimen from the Natural History Museum in Verona

How are visualizations framed? As part of a design session we brainstormed about the ways visualizations are framed:

  • They are framed by texts like labels, legends, titles, captions, and other explanatory texts.
  • They can have links to other texts, other visualizations, or even help systems.
  • They will have controls that are part of the frame of the visualization itself. These controls are sometimes right in the visualization (direct manipulation) and sometimes in separate visual spaces.
  • They draw from data that you can sometimes see in other panels or get access to. The data can have different levels in that there could a corpus of texts and then a table of results of a statistical process that is then used to generate the visualization.
  • They are created by code which can sometimes be seen. You can see code in a visual programming system or spreadsheets. Some systems will show you the code that is running or give you a space to enter complex queries (which are a higher level of code that acts as a control.) In notebooks the code is visible too.
  • There will be a social frame of people interacting with the visualization and “consuming” it. They are made and used by communities whose diversity of values, positions, cultural conventions and mores are part of the conditions of their production, access, and reception. These community frameworks shape the design process. We tend to think of visualizations as being used by one person on a personal computer, but they also show up in presentations before groups of people, on television as part of a mediated presentation, on public displays and over the internet for others to look at. We need to pay attention therefore to the ways that groups of people share visualizations including the ways they show their screens to each other. Who controls group or public visualizations?

Read more